Objective
The objective of the “Tableau Dashboard: British Airways Review Analysis” project is to analyze customer reviews and ratings of British Airways and visualize key insights and trends using Tableau. The project aims to provide stakeholders with a comprehensive understanding of customer sentiment, satisfaction levels, and areas for improvement within the airline’s service offerings.
Dataset: British Airways Dataset
The dataset consists of text reviews as well as scores for different service parameters including food and beverage, staff service, entertainment, seat comfort and ground service. The dataset also contains information about the aircraft.
Dashboard
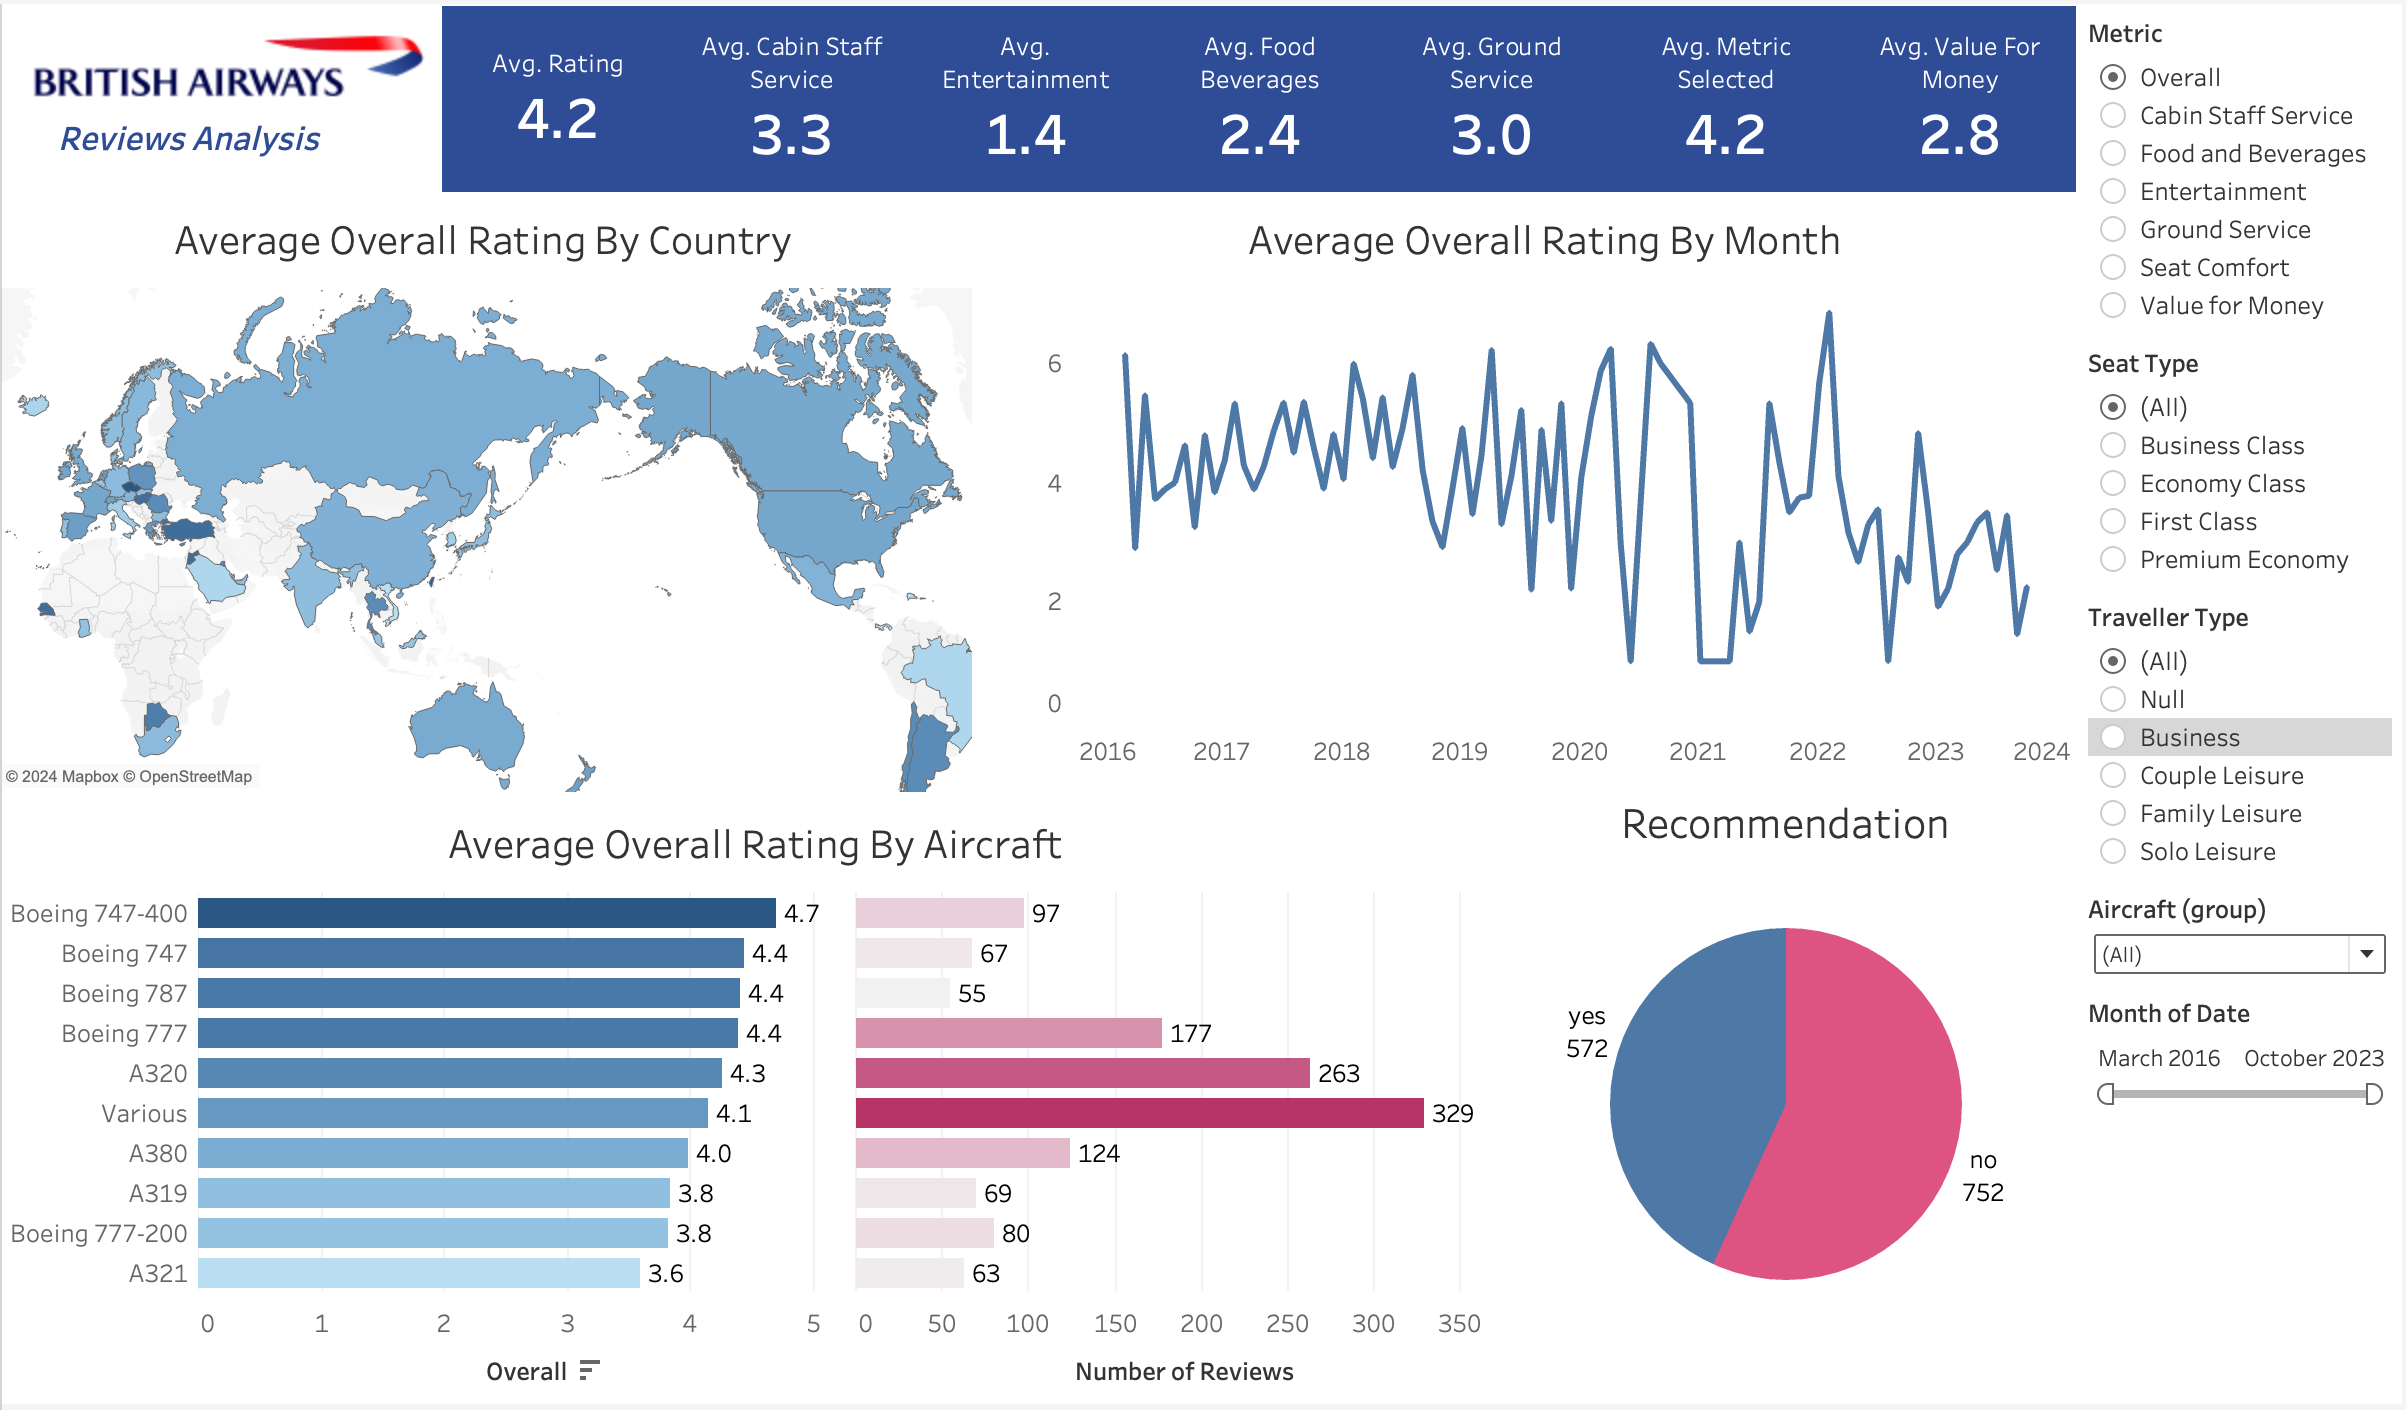
The dashboard is designed to dynamically display the average rating for the metric selected. Metrics include Overall Rating, rating for Food and Beverages, Cabin Staff Service, Ground Service, Seat Comfort and Entertainment. The dashboard allows the user to filter values based on the seat type and traveller type. The user can adjust the start and end month and year for viewing scores across different timelines.
Graphs and Insights
The dashboard depicts the following graphs:
-
Average Rating by Country
This graph visualizes the average ratings provided by customers for British Airways services across different countries. The map depicts different countries and the shaded area shows the average rating. Darker rating implies a higher average rating.
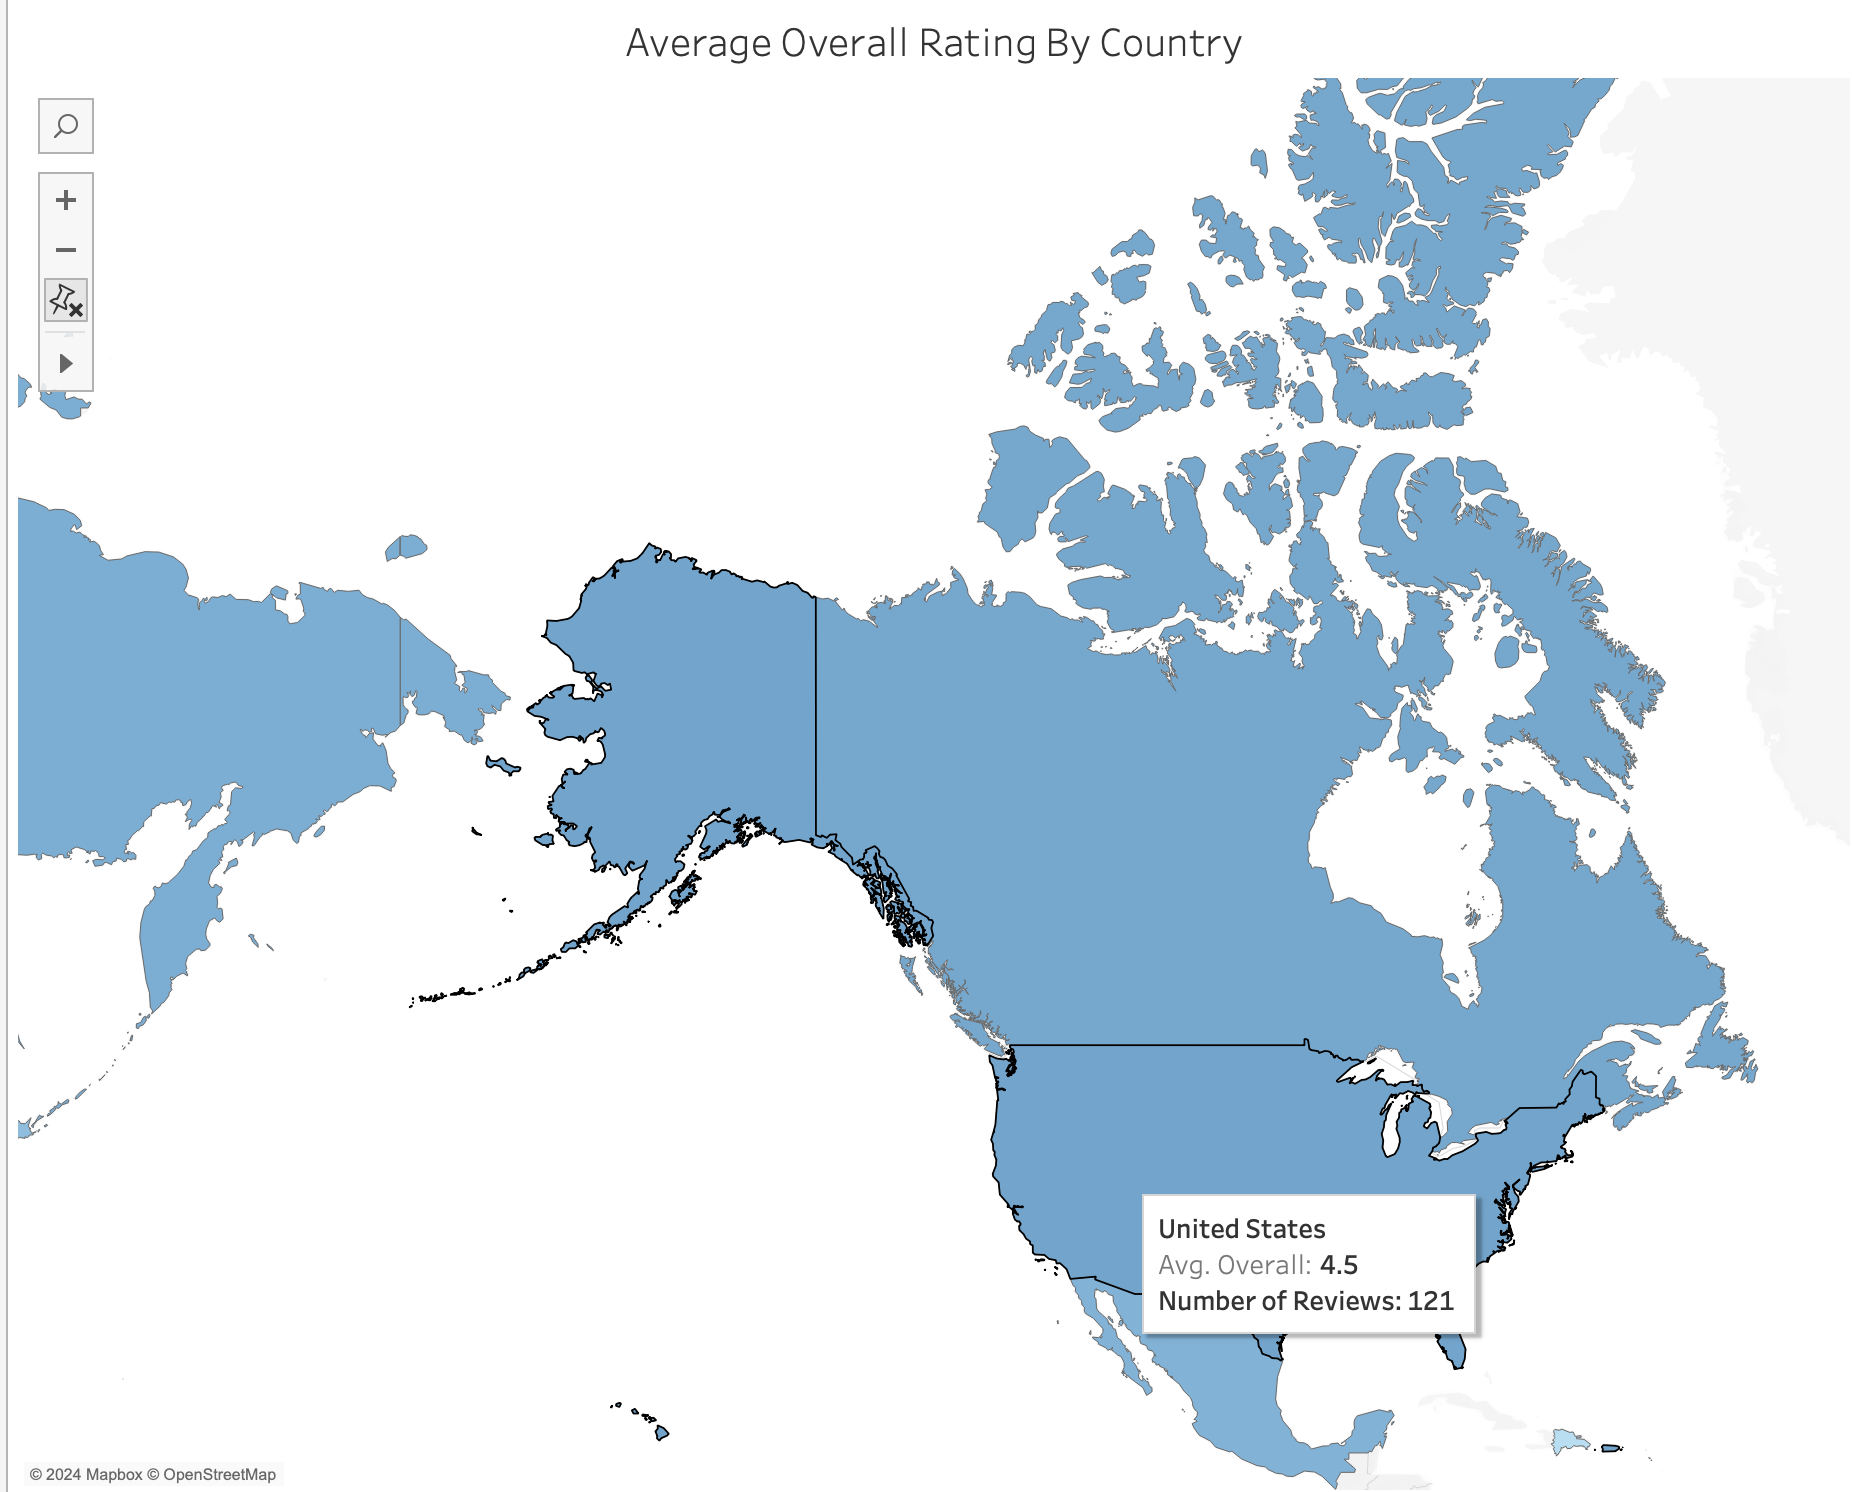
Insight: Majority people are travelling to The United States as US has the highest number of reviews.
-
Average Rating By Month
The graph depicts the average ratings received by British Airways over a period of time, with each month represented along the horizontal axis. The vertical axis represents the average rating score, ranging from the lowest to the highest rating possible.This visualization provides insights into the satisfaction levels of customers with British Airways services over different months.
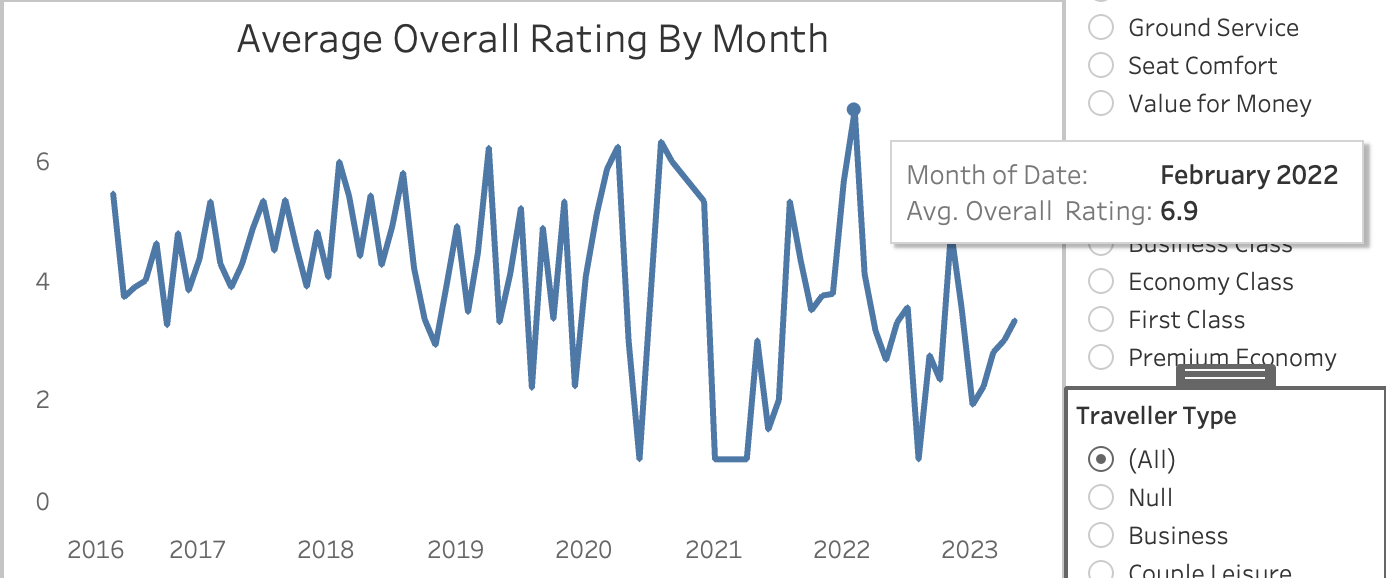
Insight: British Airways got the best average rating of 6.9 in February 2022.
-
Average Rating by Aircraft
This graph displays the average ratings assigned to different aircraft models within the British Airways flights. Each aircraft model is represented on the vertical axis, while the horizontal axis denotes the average rating assigned to flights operated by each aircraft model. This graph also shows the number of reviews for each aircraft model type. By examining the average ratings associated with each aircraft model, we can identify the most preferred aircraft.
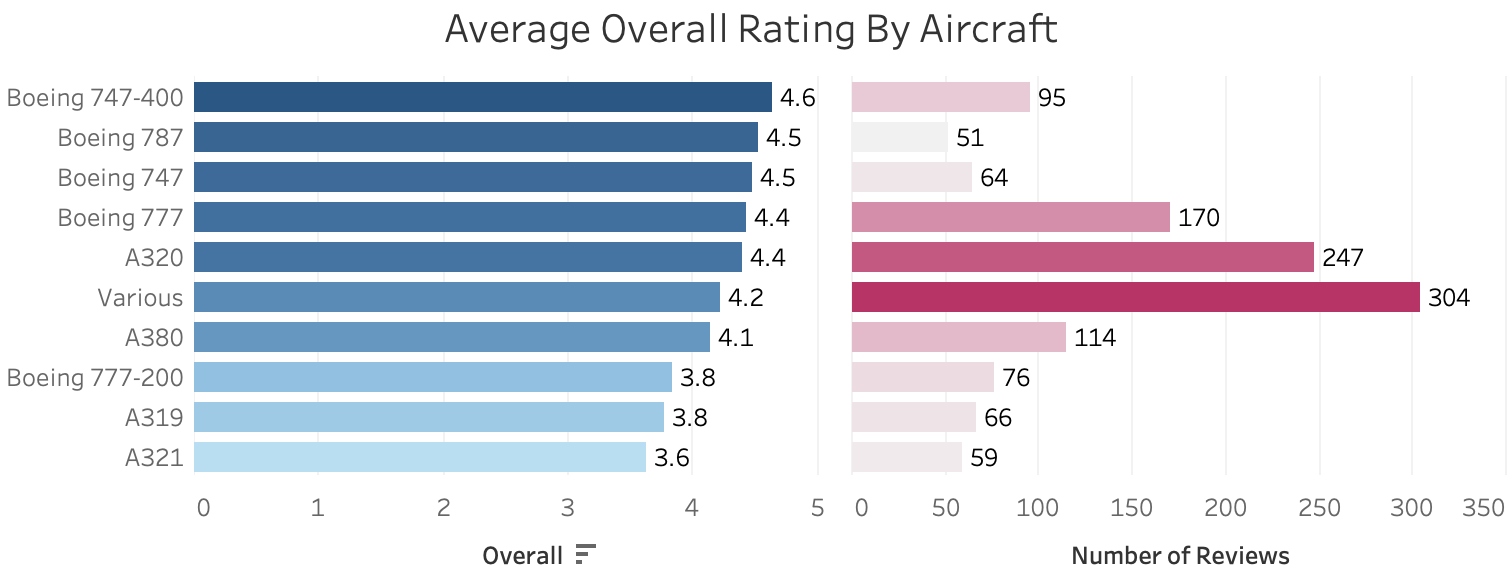
Insight: Boeing 747-700 is the most preferred aircraft.
-
Recommendation
This graph shows the number of people who recommend British Airways.
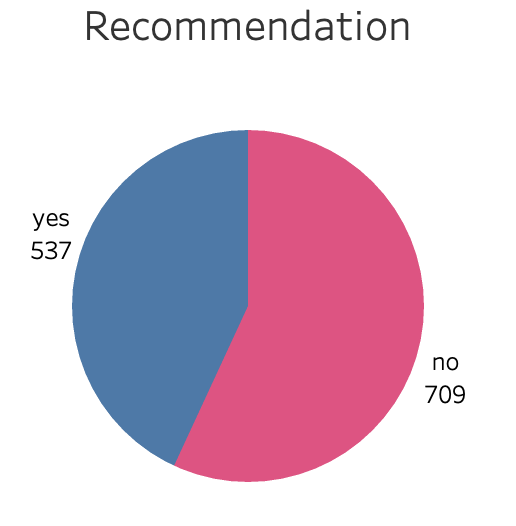
Insight: Many people don’t recommend travelling by British Airways. This might be because of the lower entertainment and food-beverage rating. British Airways may have to improve their entertainment systems as well as the food quality.